Simple Network Diagrams: Communicating Your App’s Structure Clearly
Reading time: ~ 4 minutes
This entry is part two of the series: Onboarding a New Development Team
Part 1: How to Demo Your Application to a New Development Team: A Helpful Guide
Part 2: Simple Network Diagrams: Communicating Your App’s Structure Clearly
Part 3: Organizing the Chaos: Why Password Managers Make Developer Onboarding Easier
Part 4: Resourcing and Coordination Basics: A CEO’s Guide to Onboarding a Development Agency
Part 5: Smart Cuts: How to Audit and Reduce Your Team’s Tool Overload
Whether you are onboarding a new developer to the team, discussing a long-term technical strategy, or working with a new agency on a project, a simple network diagram can be a huge help when describing the elements of your application ecosystem. At Planet Argon, we often work with applications that have not only existed through a number of different iterations but have cycled third-party services in and out of the application’s stack a number of times.
Why Choose a Simple Network Diagram?
Simple diagrams are fast to create, easy to understand, and can act as a shared language between technical and non-technical team members. They're especially helpful in early conversations, where clarity matters more than detail.
A more complex network diagram is important and should be made, but it can be very difficult to parse in certain conversations. Take, for example, this scenario: To get some help on a complicated upgrade project, your team has opted to bring in an external agency to manage the project. They will eventually need a more complex network diagram. But, at first, they may just need something to help them understand the different elements of the environment on which they need to base their estimate. You have an hour-long meeting, there isn’t time to go into great detail about the different elements. So you need a high-level overview - or, in this case, a simple network diagram.
Building the Diagrams: What to Include in a Simple Diagram
In our scenario above, we are trying to introduce a contracting agency to the application ecosystem in one of our first meetings together. What do they need to know?
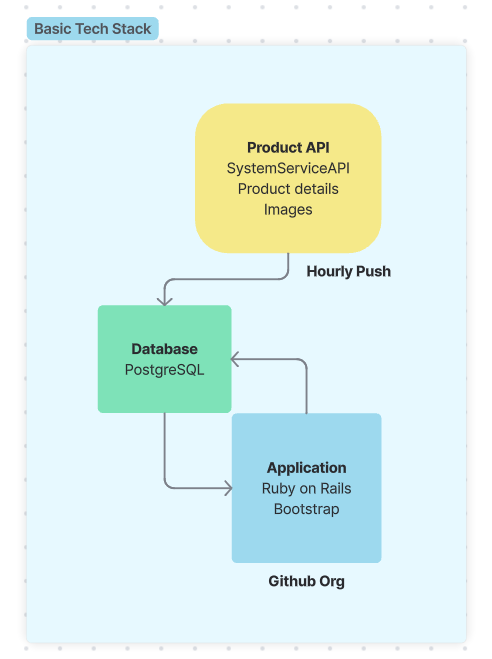
Basic Tech Stack
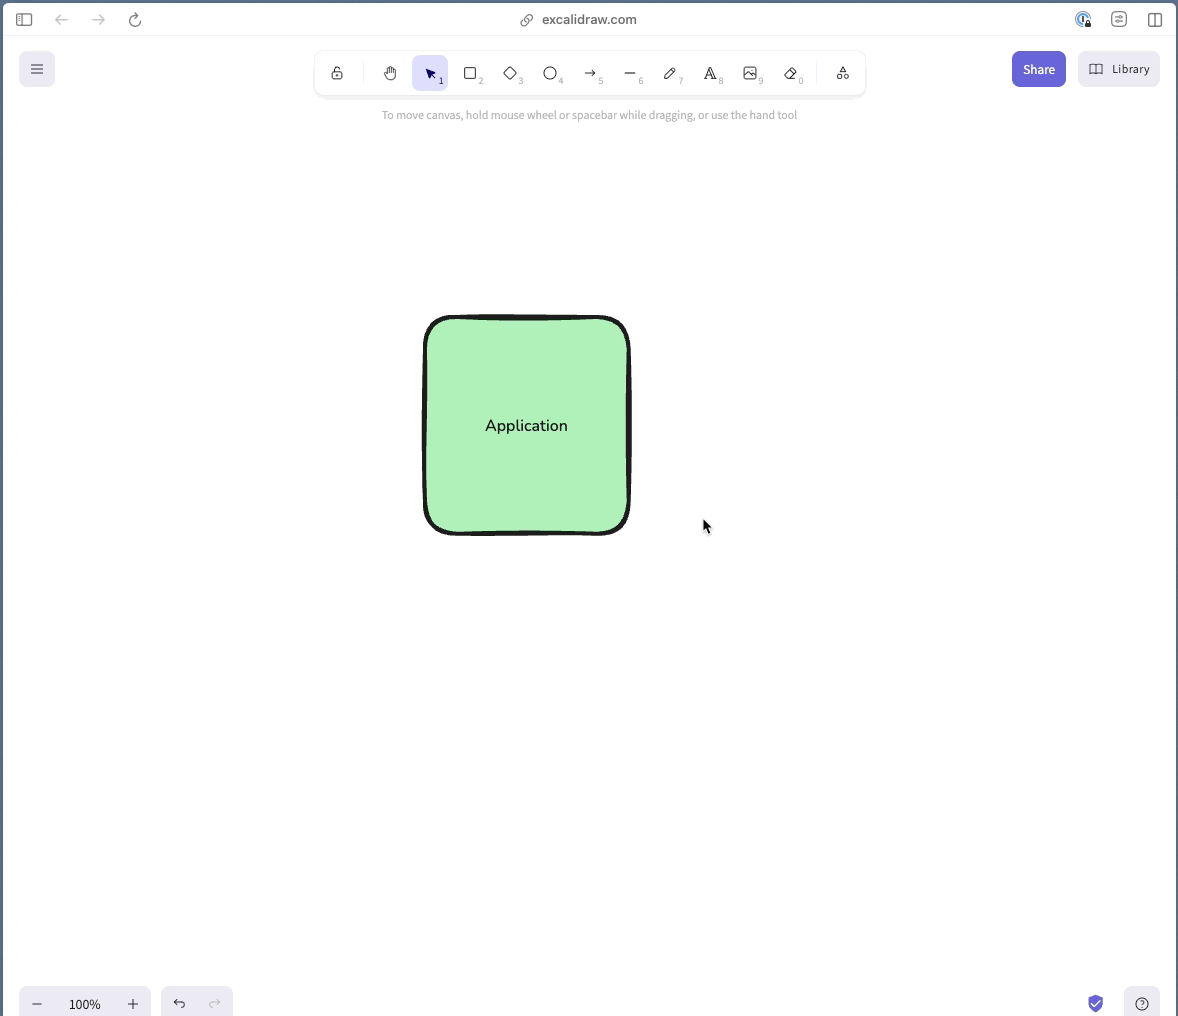
- Application Framework: In the center of the diagram, let’s add a box for The Application and label it with the framework it is written in. The picture below will show Ruby on Rails + Bootstrap.
- The Database: On one side, we have the database and its framework. In our case, we’ll use PostgreSQL.
- Big Third-Party Services: It can be tempting to list everything here, but let’s keep it simple. Are there critical services, like a product-feed API from another site to add data to your site? For now, avoid things like Google Ads/Analytics, Stripe for payments, or application monitoring.
- Label locations: Without getting into a lot of detail, we can add a simple label for where the resources are. *In our example, this would be *“AWS”** or “Github”.
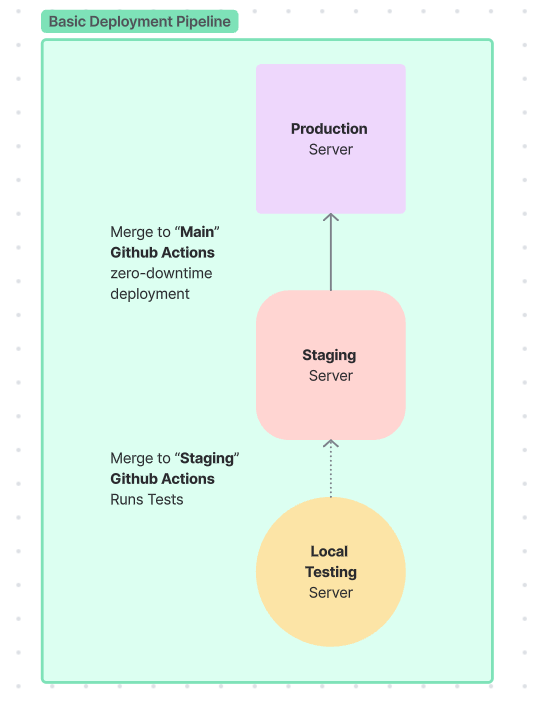
Basic Deployment Pipeline
A clear deployment pipeline helps collaborators understand how code moves from development to production. Even a simplified version can surface useful context—like whether your team uses automated tests, staging environments, or zero-downtime deployment. Some organizations have complicated steps within their deployment pipeline. It would be good to know early so estimates and time can be planned during the testing phases.
- List Big Steps: After a change to the code has been made, where does it go next? Keep these blocks fairly large. For example, there may be several different suites of tests run during the “staging” deployment. For now, let’s keep it simple with “runs tests”.
- Name Important Branches: If your deployments are automatic, based on a specific branch in the code repository, be sure to list that in the diagram.
- Structure notes in hierarchy: If there is a step order to the actions taken during deployment, try to list those elements in order. In the example below, we have: Merge to “Main”, then Github Actions, then a zero-downtime deployment. This is the literal order of operations for that step of the pipeline. This will help to keep it nice and readable.
What tools help to build diagrams?
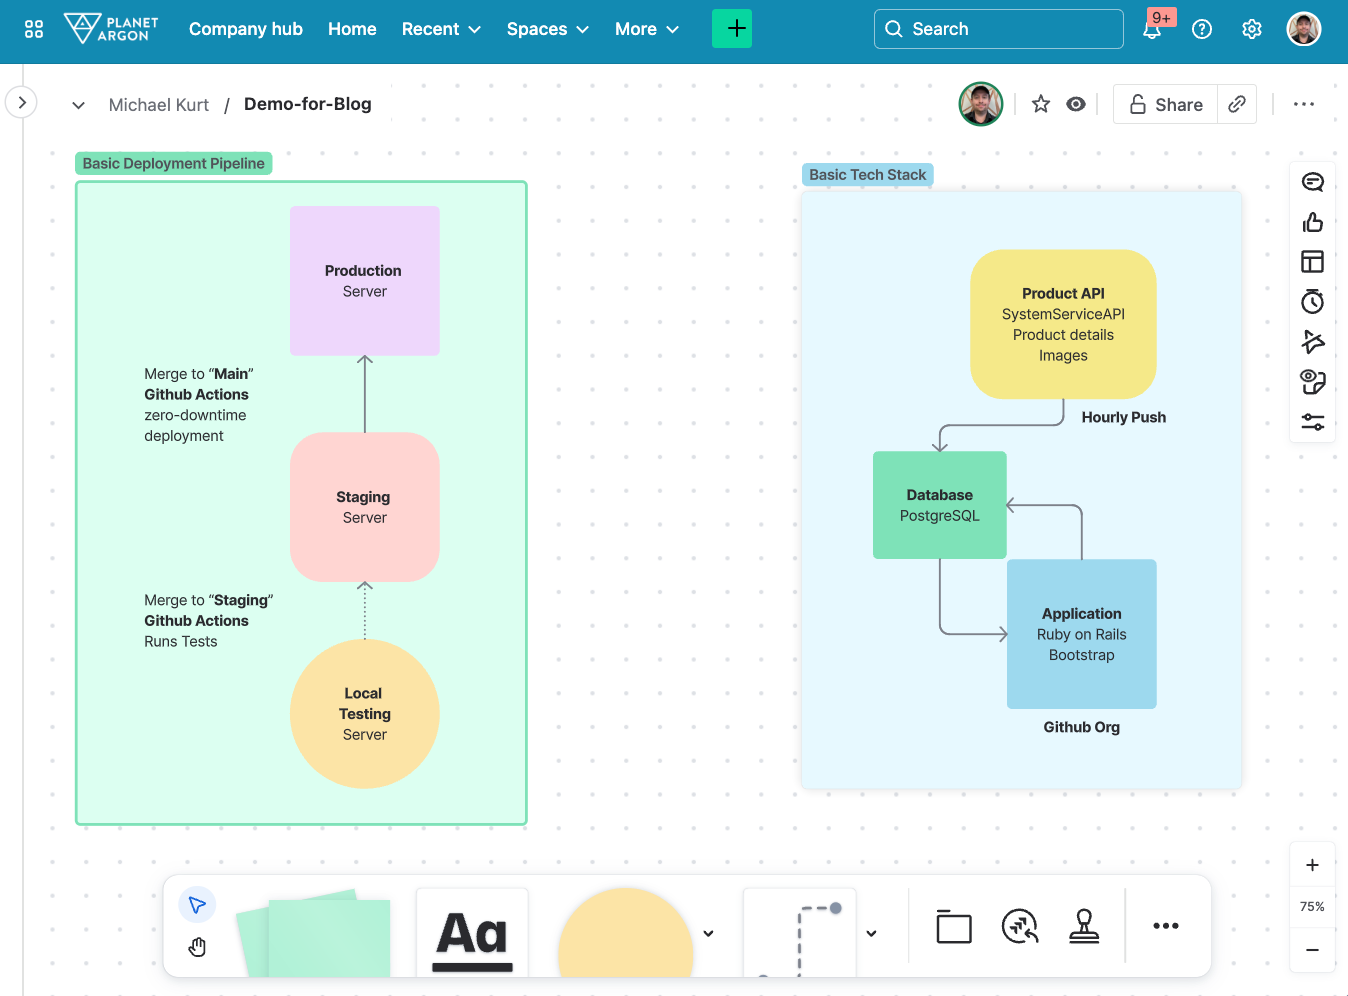
If your team is in the Atlassian system, Confluence has a clean and easy to use “Whiteboards” feature, which is what we have used to build the example diagrams for this blog! This is a paid feature for Confluence, but Atlassian offers a free trial of the feature if you have an account. Try it out!
Another tool we often use is: Excalidraw. Exalidraw has both a free and paid version. On the free version, you can only have one active whiteboard. If you do a lot of quick sketching for examples, and have no need to save them, this is a good option.
Exalidraw also has a handy Text to Diagram AI option, which allows you to get the basics of a diagram together quickly and then adjust based on the reality of your technical ecosystem.
Or, if you’re more of a pen-and-paper person, you might try creating a Fat Marker Sketch instead!
Keep it up to date
Whether planning a new feature or looking back at your systems retrospectively, it will be important to keep these diagrams up to date. By setting up a simple diagram, this process will be easy to update because the brush strokes are broad. A more complex network diagram may change more frequently.
- Set up a review cadence: for a simple diagram, an annual review might be enough!
- Assign responsibility: roles change, people move on from their positions. Attach this job to a specific department or role to keep it at the top of mind.
- Update after major releases or infrastructure changes.
Who is this diagram for?
Don’t be afraid to pull out the diagram: It might not be necessary for every discussion, but this simple diagram can go a long way to help explain your application’s ecosystem to any number of audiences: onboarding a new developer, aligning with a project manager, or giving your CEO a high-level view of the app’s environment. You can even use it when discussing infrastructure with potential vendors or partners.
There is just enough information in a simple diagram to get a point across without giving away too many specific details, so this makes it perfect for a general audience.
Engineers will need more details. People responding to emergencies will need more specific information about where systems are located or how they interact. But for those quick onboarding meetings, a simple diagram is the perfect way to get to the meat of a conversion quickly.
We Think You’ll Also Enjoy Reading…
- How to Demo Your Application to a New Development Team: A Helpful Guide
- Linear and Jira: Making the Right Call for Your Team’s Workflow
- Client Onboarding: What to Expect in Your First Month with Planet Argon
FAQ’s
Q: What is a network diagram in software development?
A: A visual map showing the main parts of an application and how they connect—used to explain systems quickly.
Q: When should I create a network diagram for my application?
A: At the start of a project, during onboarding, or when introducing new partners to your system.
Q: What should I include in a simple app diagram?
A: The app framework, database, key services, and basic infrastructure like where it’s hosted.
Q: How often should I update my app diagram?
A: Once a year or after major changes to the application or infrastructure.