How to Chart Page Load Time and Bounce with Google Analytics and Spreadsheets
Reading time: Less than a minute
We recently spoke with one of our clients about improving their site performance; specifically, we chatted about the relationship between page load time and user satisfaction. I found a number of articles relating page load speed to bounce rate, but there’s no study as convincing as an analysis of a client’s own statistics. With the help of Annie, our very own analytics expert, I was able to fumble my way through the creation of a helpful chart plotting load time versus exit and bounce rates using Google Analytics and Google Spreadsheets.
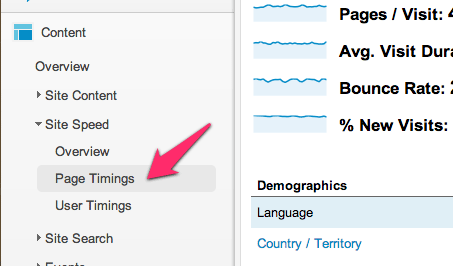
1. In Google Analytics, navigate to Content > Site Speed > Page Timings
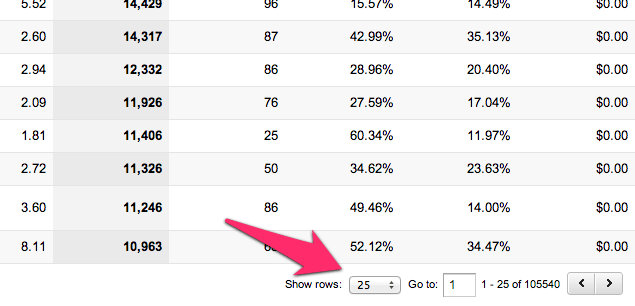
2. Show rows: select the amount of data you want to use in your chart
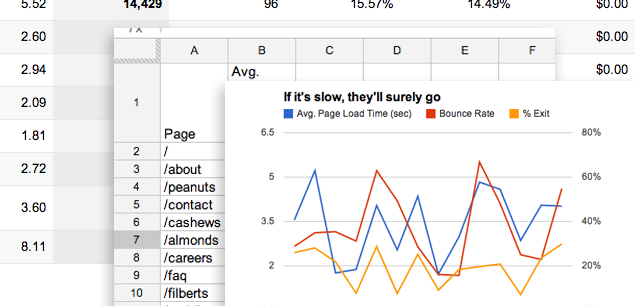
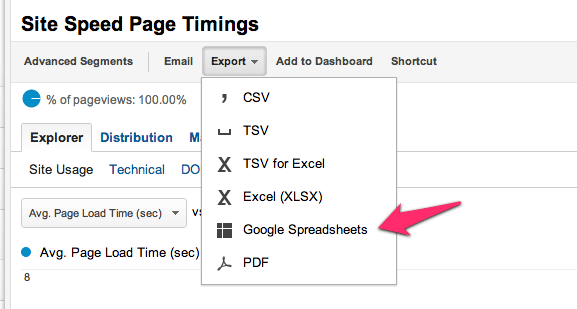
3. Export > Google Spreadsheets
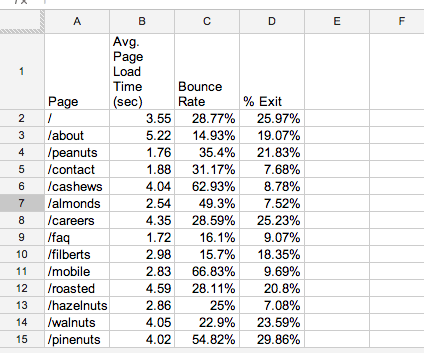
4. Remove columns and rows unnecessary for the comparison (be sure to eliminate the first blank row)
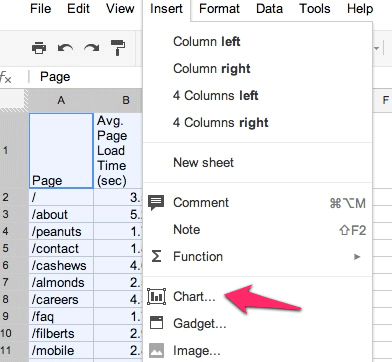
5. Select all columns and rows you want to include in the chart; then Insert > Chart
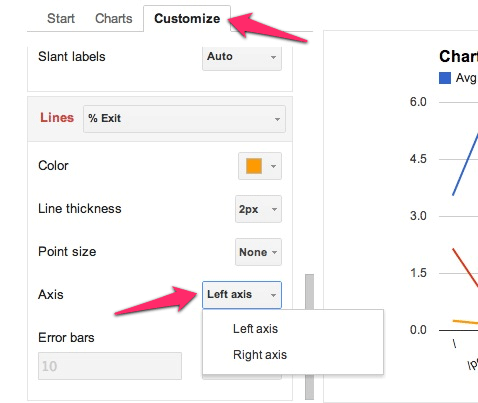
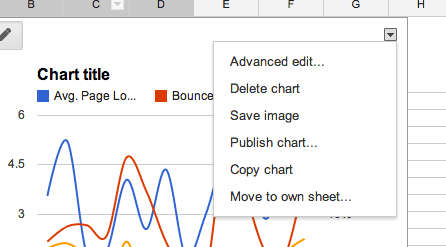
6. Select Line Chart, then select the Customize tab.
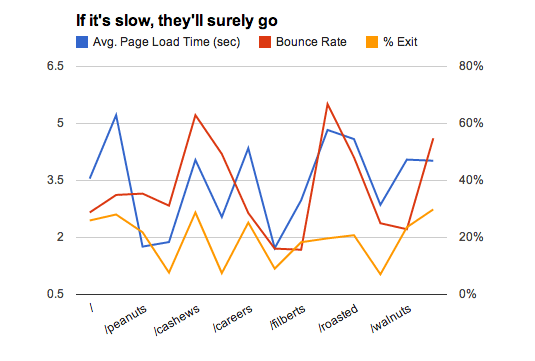
You can choose to make cosmetic changes (like changing line thickness or point size) now or later, but this next step is extremely important: make sure that the lines representing page load time, bounce rate, and exit rate are all using the correct axes. By default, the chart will be plotted using just the left axis but this isn’t ideal. You want to make sure that the average page load time, which is measured in seconds, is using one axis (I chose left), and the bounce and exit rates, measured in percentage, are plotted against the opposite axis (I chose right).
7. Insert the chart, and customize to your heart’s content.
Using the chart as a visual representation of the relationship between slow pages and exiting users, we were able to see quite clearly that there was a pattern: where the blue line spikes (pages that are particularly slow), the red and yellow lines (pages from which users tend to exit the site) spike as well. Thanks to this data, we’ll have the opportunity to spend some time improving our client’s site performance and enhancing the experience for their visitors.