Untangling a Slow Rails App: The Framework We Use Every Time
Reading time: ~ 6 minutes
Your Rails app has been running fine for years. You’ve added features, your data has grown, your user base is bigger than it used to be, and everything seems hunky dory.
Then, one day, you realise that somewhere along the line, your application slowed down. It crept up on you so gradually that it seemed normal. A page takes a few seconds longer to load than you recall. Background jobs don’t clear out overnight. Maybe you’ve even scaled up your instances, hoping more horsepower would make the problem go away. But the truth is, you’re paying more, and your app still feels sluggish.
That’s a frustrating place to be. The not-so-great news is that performance problems rarely have one neat cause. Such is life… They can hide anywhere - in the application code, the database, or the infrastructure configuration. When everything feels like a suspect, where do you begin?
Our Framework
That’s where having a simple framework helps. Instead of poking around at random or guessing, we follow the same five steps every time we’re called in to untangle a performance problem:
- Monitor - Make sure you have visibility. Without logs, metrics, and traces, you’re flying blind.
- Measure - Establish a baseline. What’s slow, how often, and how bad is it?
- Analyse - Break the requests and jobs down into parts. Is it the database? The application code? Infrastructure?
- Prioritise - Not every slowdown is equally painful. Fix the most important ones first - those that impact users or costs.
- Validate - Confirm that your fix made a difference, and then move on to the next one.
Monitor
The first place we usually look is inside the application itself. Code and database instrumentation help us answer questions like: Which endpoints are slowest? Which queries are eating up the most time? Are there errors or exceptions piling up behind the scenes?
At the infrastructure level, we’ll use a variety of tools to determine whether the app is starved for memory, threads, or database connections. Metrics like instance restarts, router queue times, or CPU thrash tell us whether the app’s code is the problem or if the environment it’s running in is holding it back.
Measure
With monitoring in place, the next step is to establish a baseline. How slow is “slow”? Which endpoints are consistently lagging, and which are fine? We look at median (p50) and worst-case (p95) response times to understand how the app feels for typical users and for those who hit the slower paths. Of course, not every request is created equal. An admin export might legitimately take longer than a homepage load. That’s why we measure different types of requests separately and compare them against what’s actually expected.
Analyse
With data in hand, we can then break requests and jobs down into their parts. Is most of the time spent in the database? Rendering views? Calling out to a third-party service? This step is where patterns start to emerge like certain user actions always spiking query times or background jobs slowing down during peak traffic hours.
Prioritise
Pick your battles! Not every bottleneck is worth fixing right away. Some might only affect a handful of admin users, while others impact every customer on the homepage. We rank issues by impact and effort so we focus on the ones that deliver the biggest return first.
Validate
Performance work isn’t finished until you prove it worked. Once we apply a fix, we go back to the numbers. Did the change actually reduce response times or error rates? If not, we adjust and try again. This feedback loop keeps us from celebrating “fixes” that didn’t really move the needle.
Common Bottlenecks We See
When we start following this process, the culprits often fall into one of these categories:
Database queries - Missing indexes, inappropriate table locking, tables that have grown faster than expected, or queries that scan way too much data. An N+1 query on a popular page can grind everything to a halt.
Inefficient code - Serializers doing too much work, heavy callbacks, or business logic that made sense for 10k records but not for 10 million.
Background jobs - Queues that never quite catch up, retries stacking up, or jobs competing with web processes for the same database connections.
Infrastructure setup - Puma workers and threads not tuned for the database pool, application instances hitting memory ceilings and restarting, or slow third-party APIs blocking the request cycle.
Each of these, on its own, can slow an app down. More often than not, there’s a mix of them. That’s why we don’t jump straight to one area - we start with data, then let that evidence guide us to the biggest wins.
A Brief Example From the Argon Archives
Last year, one of our clients hit a sudden wall during a spike in traffic. From the outside, it looked like the app just couldn’t keep up: users saw timeouts, the load balancer was reporting errors, and background jobs started piling up.
At first glance you might think, “just add more servers.” And in fact, the API nodes were autoscaling correctly - new instances spun up as load increased. The problem was deeper: the database couldn’t keep up.
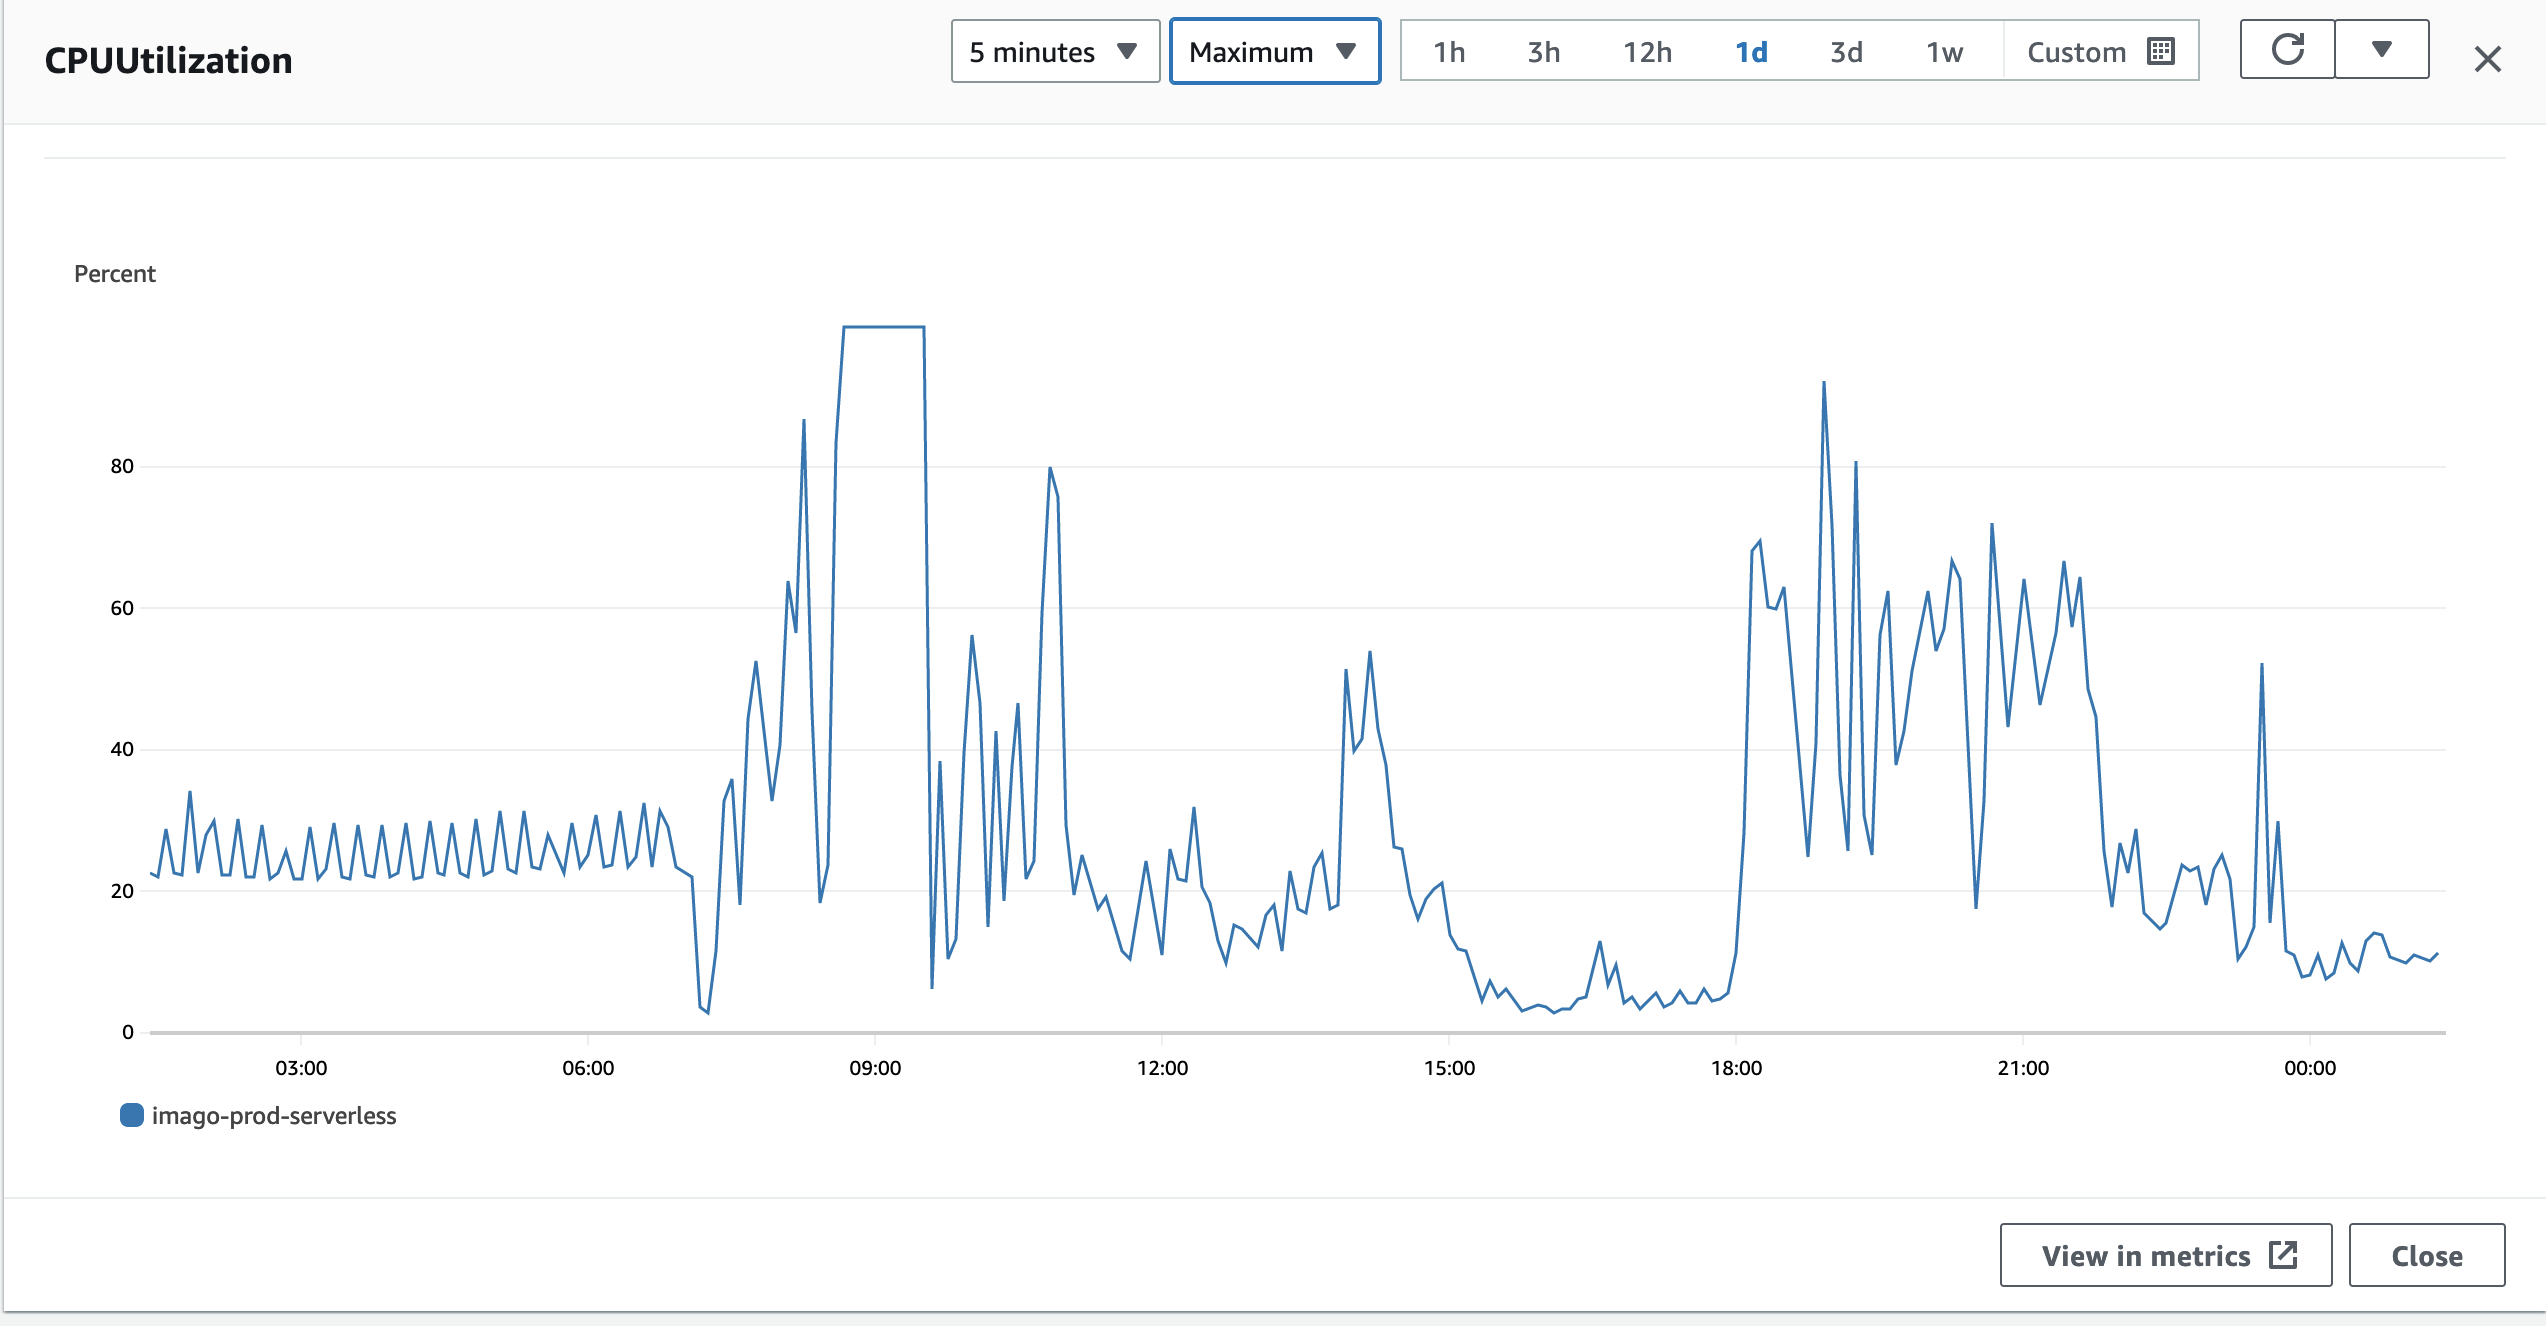
Digging into the metrics, we found a couple of endpoints that were taking 15 minutes or more to return. Those requests were hammering Aurora Serverless Postgres until CPU utilization flatlined at 100%. At that point, it didn’t matter how many API nodes we threw at it — every request was still getting bottlenecked by the database.
The lesson: infrastructure scaling won’t solve application-level inefficiencies. The real fix here was to optimize the queries behind those slow endpoints and rethink how that data was being fetched. We recommended increasing Aurora’s capacity in the short term to give the team breathing room, but the long-term solution was code and query optimization, not more hardware.
How our framework was applied here
Monitor – Load balancer metrics and New Relic traces made the problem visible: errors were spiking, requests were taking hundreds of seconds, and the DB CPU was stuck at 100%.
Measure – We confirmed that two endpoints were the culprits, each taking 800–900 seconds to complete. That gave us a clear baseline against which to improve.
Analyze – Breaking down the request flow showed the bottleneck wasn’t the API nodes (autoscaling was fine) but the database layer. Aurora was maxed out because of expensive queries.
Prioritize – It was tempting to focus on scaling the API nodes further, but the real priority was the slow DB transactions dragging down everything else.
Validate – In the short term, we increased Aurora’s capacity to buy stability. Next, we focused on optimizing those queries and tracked p95 response times to confirm they dropped back into a healthy range.
How did we optimise those queries?
Digging in, we saw they were pulling data from several different tables every time a user loaded the associated page. The thing was, most of that data didn’t really change from one request to the next, as it was basically static.
That made caching an obvious first step. We added caching around the rendered results so the app wasn’t hammering the database over and over. From there, we took it a step further: we denormalized some of the data to make reads even faster. However, we only did that where it made sense from a modeling perspective. We didn’t flatten the database in ways that would mess with the business logic or break the boundaries between models.
Instead, we created a few lightweight, read-optimized versions of the data that background jobs could refresh when needed. The end result was faster pages for users, quicker cache warm-ups, and a big drop in our p95 response times, all while keeping the core domain logic clean and intact.
Why a Framework Matters
Without a structured approach, performance work can feel like whack-a-mole. You fix one thing, and two weeks later, a new symptom appears somewhere else.
This five-step loop gives you confidence that you’re working on the problems that matter, not just the ones that are easiest to spot. It also makes improvements measurable: you know how fast things were before, you know what changed, and you can prove whether or not it worked.
What’s Next?
Performance problems are stressful because they affect your users directly. It’s tempting to keep throwing more hardware at the issue, but that usually just buys you time without addressing the root cause.
The good news is that you don’t need to guess where to start. A repeatable process - monitor, measure, analyze, prioritize, validate - keeps you focused and helps you find the real issues.
If your Rails app is slowing down and you’re not sure where to start, you’re not alone—and it’s more fixable than it feels. With the right framework and a clear plan, we can help you uncover what’s really holding your app back and get things running smoothly again.