
In 2009 we asked the community how they hosted their Rails applications. Over 1,200 people chimed in with their answers. Once the data was compiled, we released the results to the community so that everyone could see where we were and where we were going.
In 2012, we set out to find what had changed over the last three years.
This time around 1,306 people took time out of their days to let us know how they were hosting their apps.
As before, we’re releasing the results back to the community along with this handy infographic that we’ve put together.
Let’s take a look at the data.
Rails Community – Still Growing

It looks like Ruby on Rails is still attracting new people, with over 25% of the respondents saying that they’ve joined the community in the last two years.
Ruby and Rails Versions – Old and New
This year, we asked two new questions. We wanted to know what versions of Ruby and Ruby on Rails people have deployed out there.
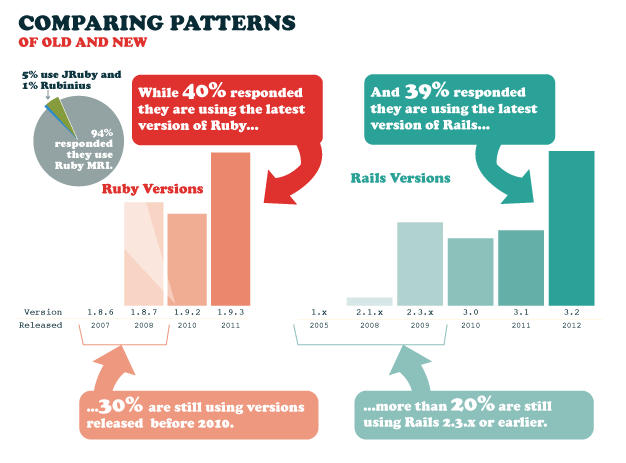
The data is interesting. 45% of people reported that they had at least one application out there still running on the venerable Rails 2.3.x version. In addition to that, 85% of people have deployed an application running on Rails 3.2.
On the Ruby side, a similar trend emerges, over 50% of people said that they were using Ruby 1.8.7 (either REE or MRI), but people overwhelming said that they also had applications running on Ruby 1.9.3.
I think that this shows that the community is pragmatic, supporting applications that are older, but unafraid of adopting the latest and greatest when the opportunity presents itself.
A Few Surprises
There were a few surprises this year.
In 2009, 80% of people said that they were using MySQL and 63% said that they preferred using said database server. This year, PostgreSQL eats up a large chunk of MySQL’s market share. 40% of people said that they were using Postgres in production and 60% of people said that they wanted to use it in production.
Although the majority of developers are keeping track of exceptions there is a significant number of developers that aren’t; nearly 30% of all developers.
Of those developers that are tracking exceptions, the most popular method is by using the Airbrake app (formerly known as Hoptoad). Airbrake zoomed past ExceptionNotifier gobbling up 50% of the vote. ExceptionNotifier used to reign in this space with 53% of the vote in the last survey.
This is the first year that we’ve asked about the use of Continuous Integration and we were surprised to see the number of people that aren’t using one so high. 64% of people said that they aren’t using a CI server.
Of the people that are using a CI server, Jenkins is by far the most popular with nearly 66% of the vote with Travis CI coming in a distant second with 27%.
One more surprise showed up in the results from this year. Apache and Nginx did a bit of role reversal.
In 2009, 69% of people said that they were using Apache, while Nginx took a backseat with just 24% of the vote. In 2012, things are quite different as Nginx is now the leader with 61% of the vote and Apache drops to 35%.
Predictable Trends
In addition to the surprises this year, there were some predictable trends. In 2009, over 60% of the people chose Git as their source control software, but there were still 36% of people out there using Subversion.
In 2012, people resoundingly chose Git. That number jumped to 94% and Subversion withered away to a mere 4%.
Another unsurprising trend is the battle of the Rails servers.
In 2009, 38% of people were using Mongrel. In 2012, someone let the dogs out but they didn’t come back. Mongrel’s share dropped down to a measly 3%. Most of this market share went over to the relatively new upstart Unicorn, while Passenger picked up a few percentage points to its lead.
Wrap-up
It’s definitely been interesting seeing the trends in between the two surveys and I think it’s going to be interesting to see what happens in another few years.
Where do you see trends going in another 3 years?
Infographic
Yes, we’ve put together an infographic for your consumption!